Whether you invest in Facebook influencers to help your marketing or you run your Facebook page yourself, you need to monitor how your Facebook activity is performing regularly. An essential part of both content and influencer marketing is goal setting. To be valuable, goal setting needs to be SMART (specific, measurable, achievable, realistic, and time-targeted). Therefore, you need to be able to measure your marketing activity in some way. Luckily, there are many Facebook metrics brands can track to determine the success of their goals.
You won’t be interested in all these metrics at the same time – only those that show how well you are achieving your goals. However, you are likely to change your goals over time, and as you do so, you will need to alter the Facebook metrics that give you the most interest.
8 Facebook Metrics That All Brands Should Track:
Reach
Reach is an indication of the number of people who see your material on Facebook. To be honest, you might be particularly disappointed by your reach statistics. The days when Facebook served up your posts to all your followers in chronological order are well gone.
In fact, thanks to the algorithm that Facebook now employs, the reach of most posts is incredibly low. A Facebook post’s average organic reach is only around 6.4% of the Page’s total likes. In other words, Facebook will only serve up your new posts to about 6 people out of every 100 who push the Like button on your Facebook page. If you have 1,000 Facebook likes, 936 of these people will never see your post in their feed.
This is a classic case of quality being more important than quantity. You will never improve your reach with mediocre run-of-the-mill posts. It will only happen when you create compelling, high-quality posts that engage your audience.
You can find details of your Facebook Reach in your Facebook Insights (for your own account). If you are working with influencers, you will need to rely on them (or your agency if you’re using one) to supply you with reach (or indeed most other Facebook metrics.) Note that Facebook Insights relates to Facebook pages, not your personal Facebook profile.
You will see Post Reach summarized in the Page Summary part of your Facebook Insights. Further down that page, you will see a graphical depiction of it for you five most recent posts, or more if you click on See All Posts.
You can get more detail by clicking on the Reach button in the left-hand menu. This brings up a series of graphs depicting the reach of your posts.
Impressions
There is a subtle difference between Reach and Impressions. Reach tells you the number of people who have seen your posts, while Impressions shows you the number of times that a post has been observed. The difference is that if somebody returns to your post and looks at a second time (or more frequently) each visit adds to your Impressions total, but only the first visit counts as Reach.
The Impressions stat is somewhat hidden in Facebook Insights because it is not included on the Summary page. To find it, select Posts in the left-hand menu. Scroll down the page until you see All Posts Published. You will notice a downwards arrow beside the Reach term in the key at the top of the section. Click on that arrow and select Impressions: Organic / Paid from the list of options. In all cases, Impressions will be equal to or higher than the Reach for a post.
Impressions can indicate how viral a post is. For example, you might see a post once in your feed. That’s one impression. However, if a friend shares the same post with you, that’s a second impression. You are likely to find that multiple friends share truly viral posts with you, increasing the Impressions total each time.
Engagement
Engagement is a critical Facebook metric. This tells us how often people made an action as a result of one of our Facebook posts. Facebook actions include clicking on a link, liking (or one of the other reactions) your post, sharing your post, or making a comment.
You can also find details of your Facebook engagement in your Facebook Insights. These appear in several places. Your Page Summary includes an overall graph on your Overview page and post-by-post on the Posts page.
Don’t underestimate the importance of engagement. You might have impressive reach or impression statistics, but these don’t give any indication that people are taking any notice if what you are posting. If somebody is engaging with you, it means that they are taking the time to react in some way to your post,
Engagement is an integral part of Facebook’s Newsfeed algorithm. The more engagement you have on a post, the more Facebook will place the post into your followers’ feeds. More than that, if you have consistently high engagement on your posts, then Facebook will show more of your other posts, as well. You will see charts for Recommendations (the number of times that people have recommended your Page), and Post Engagements (defined here as the number of times that people have engaged with your posts through likes, comments, shares and more.)
Further down the Overview page, you will see a graphical depiction of Engagement (split into its components) for your five most recent posts, or more if you click on See All Posts.
Page Likes and Follows
You will generally want a gradual increase in your Facebook followers and those who Like your Facebook page. Thee may rise more rapidly if you set up a campaign with that as its primary purpose, but at other times you want a gradual rise, indicating regular steady progress. If you see a significant burst in follower numbers, for no apparent reason, you should be wary that these may be bots, and not be genuine followers. On the other hand, stagnating numbers suggest that you are becoming less attractive online, and falling numbers could mean that people are actively disliking you.
You will see your total page likes (including additional likes this week) and follows on the righthand side of your Facebook page.
You can gain additional information in your Facebook Insights. The Overview includes both your Page Likes and Page Followers. Page Likes are defined as being, “The number of new people who have liked your Page broken down by paid and non-paid. This number is an estimate and may not be precise.” The Page Followers are defined as, “The number of new people who have followed your Page broken down by paid and non-paid. This number is an estimate and may not be precise.” The two statistics tend to be reasonably similar.
Also, there are tabs on the left, giving additional statistics relating to both Followers and Likes. They include day-by-day graphs of your Followers/Likes, your Net Followers / Likes, and Where Your Page Follows Happened.
Page Views and Previews
Page Views, as the name indicates, are the number of times that a Page has been viewed by people. Obviously, the more times viewed, the more interest there will be in the Facebook page. However, don’t consider this as necessary as Engagement. There is a big difference between merely viewing a Profile Page (which doesn’t even require clicking on a post) and actively engaging with the site in some way.
Page Previews are effectively the step before coming to your page. They represent the number of times that people hover over your page name or profile picture, to see a preview of your page content.
Both Page Views and Previews appear amongst the Page Summary on your Facebook insights. They also have a more detailed page you can reach by clicking on the relevant button in the menu.
In the case of Page Views, you can choose to view your Total Views, or broken down by section. It also provides you with demographic data relating to your audience.
Facebook Referral Traffic
If one of your Facebook marketing goals is to drive people to your company blog or website, using Facebook, then you will be interested in how many people arrive at your site from social media. To find this out, you will need to look at your Google Analytics data. If you haven’t already done so, you will first need to set up a Google Analytics account.
You will find data relating to visitors to your site via Facebook in the Acquisitions section of Google Analytics. Click on Acquisitions (in the left-hand menu) > Social > Network Referrals. This will show you all the traffic referred to your site by your social activity, split up by social network, including, of course, Facebook.
If your Facebook Referral traffic is declining, it may indicate that your Facebook followers are unhappy with your content and that you possibly need to make a change in direction.
Facebook Video

Source: quora.com
Video has become more prevalent on Facebook in recent years, and it is now a much-viewed sub-section of Facebook Insights. You will find one reference to videos in the Overview section. This shows the number of times that your Page's videos were played for at least three seconds, or for nearly their total length if they're shorter than three seconds, broken down by total, paid and non-paid impressions.
You’ll get more detail in your page’s left-hand menu under Videos. These include stats such as the number of minutes viewed and the number of 3-second video views. It also shows you your highest-performing videos by minutes.
Remember that there are a variety of different types of video content you can have on Facebook. These include videos in your feed, skippable, non-skippable, video in Stories, and Facebook Live TV.
To see metrics for your video, go to the Posts tab within your Page Insights. From there, scroll down to the 'All Posts Published' to see all the posts you have published on your Page. Clicking on the post title for your video (marked with a video camera icon) will take you to your video metrics for each post.
The audience retention graph shows your video's retention over time. Hovering over the diagram captures what frame in your video corresponds to a specific time and retention percentage.
You can also find video engagement metrics. You can see find your video's total 28-day engagement, a breakdown of the likes, comments, and shares on both your original post and re-shares as well as any negative feedback on your video.
Key Facebook Ad Metrics
You will find an extremely detailed list of metrics available if you run Facebook Ads. We will only touch on them briefly in this article. Facebook provides so much data that it would be easy to get lost amongst the numbers, so it is essential to remember the goals you set for your advertising campaign. You will want to focus on those stats that measure your progress towards meeting your goals.
You create your ads in the Facebook Ads Manager tool. The first step of creating a new ad campaign is to choose an objective – this clearly needs to relate to what you want the ad to accomplish. Facebook splits these into objectives concerning Awareness, Consideration, and Conversion. For example, the aim of increasing Traffic is classified as Consideration. If you want to use your ad to drum up more Store Visits, that’s Conversion.
Facebook Ads Manager provides you a dashboard full of data related to your campaign.
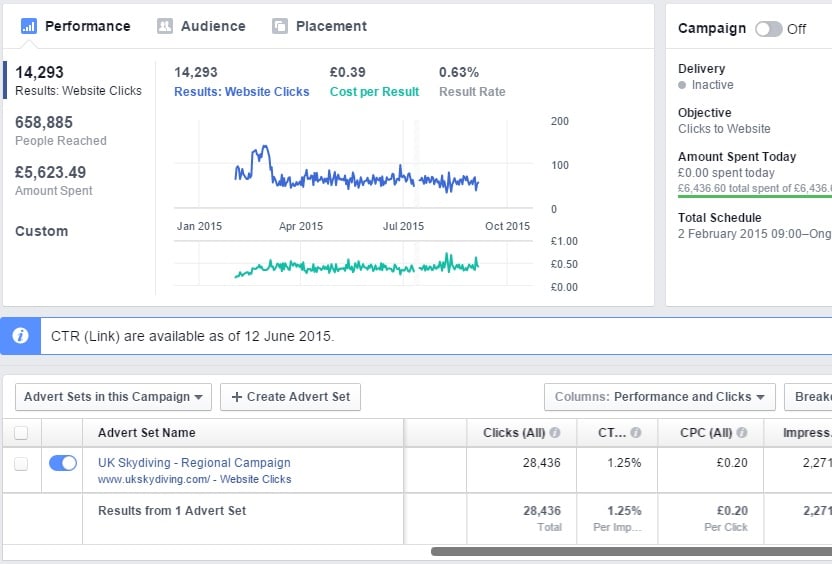
Source: Moz
Some of the data that may be of value to you, depending on the ad campaign objective you have set include:
- Cost per Result – this shows the average cost of your ad based on the result (where the result is a custom metric you define based on your specific goal). For example, if your goal is to sell more of a particular item (Conversion-related), then you will be interested in the cost (of your Facebook advertising) per sale you make.
- Ad Impressions – this tells you how many times your ad was viewed.
- Ad frequency – this tells you how many times your ad was viewed, on average, by an individual. You will want this high for a branding campaign. However, for a lead generation or e-commerce campaign, you’ll want to keep your frequency number lower.
- Ad Clicks – this represents the number of times someone has clicked on your ad. Generally, you will want this number to be higher as it indicates that people are interested in your campaign.
- Click-Through Rats (CTR) – this tells you the percentage of people who click an ad from all the people who saw it. Obviously, the higher, the better for this stat.
- Cost Per Click (CPC) / Cost Per Impression (CPM) - CPC shows how much you’re paying when someone clicks your ad. CPM shows how much you’re paying per 1,000 views. The more relevant an ad is, the less it costs for you to run it.
- Conversion Rate – this tells you what percentage of people who click your ad goes on to make a purchase and become a customer.
- Cost Per Conversion – this tells you how much you’re paying for each lead or sale.